
Working With Reports, Part 2
Working With Reports in QuickBooks, Part 2
QuickBooks provides tools for working with reports you’ve created. Here’s a look at some of them.
Last month, we laid the groundwork for creating reports in QuickBooks. We walked through the mechanics of creating them and introduced you to the Report Center. We showed you how to customize them so you can target the exact blocks of data that you want. We also talked about QuickBooks’ ability to export report data to Excel so you can format and display it in even more meaningful ways.
So now that you understand the basics, we’re going to expand on them this month. We’ll go over some of the other options in the Reports menu. We’ll discuss concepts like commenting on reports and memorizing report templates. We’ll also introduce you to some more sophisticated reports that we can analyze for you. Well-crafted reports can be immensely helpful as you make critical business decisions, so it’s important to learn how to use them wisely.
The Reports Menu
We used the Report Center in last month’s column to direct you to common reports. But there are options in the Reports menu itself that you should know about. The first three are:
Memorized Reports
Once you’ve customized a report, you may want to save the template so you can run it again with new data in the future. Open the report whose framework you want to save, like A/R Aging Summary (who owes you money? Are any of them past due, and by how much?). Do your customizing (Customize Report). When you’re satisfied with your changes, click Memorize in the toolbar. In the window that opens, give your report a Name and choose the appropriate Memorized Report Group if you want to store it in one. If not, just click OK. To find your reports, go to Reports | Memorized Reports.

You can memorize report templates you’ve created and store them for later use with updated data.
Scheduled Reports
If you want to schedule reports to go out to employees or your colleagues or accountant on a specific date and time, please schedule a session with us. This is a complex process to set up.
Commented Reports
This tool can be very helpful if you share reports with others. It can also just remind you to follow up on a question. Open the report you want to respond to and click Comment on Report in the toolbar. QuickBooks opens a second copy of the report that overlaps the original. Each transaction displays small boxes in front of individual numbers and dates in the report.
To comment, you just click in one of these boxes and enter your comment in the box that opens below, then click Save. The box you clicked in will change to a number corresponding to the actual comment in the box below. When you’re done making comments, click Save in the upper left corner. Give your commented report a different name, one that you’ll recognize, and click OK. You can find this report later by opening the Reports menu and clicking Commented Reports.

QuickBooks assigns each comment a number so you can find it easily in the box containing all of them.
The Cash Flow Hub
Cash flow is a more complicated concept than you might think. It’s different from profitability. Your business may appear to be profitable but could still have a negative cash flow, as confusing as that sounds QuickBooks offers two tools that help you gauge your cash flow. One is the Cash Flow Hub, which is basically a collection of charts that show money in and out, cash balances, and trends.
Then there are two reports that you’ll find by opening the Reports menu and clicking Company & Financial: Statement of Cash Flows and Cash Flow Forecast. Unless you’re very familiar with how cash flow works, we recommend that you schedule a session with us so we can interpret this data for you.
The Company Snapshot
The Company Snapshot, on the other hand, is easier to understand. It, too, is a series of charts and tables that can provide a quick overview of the state of your company’s finances. The information these graphics and lists provide include Income and Expense Trends, Customers Who Owe Money, and Expense Breakdown. You can click data points in these graphs and lists to see the underlying detail. We recommend you open the Company Snapshot whenever you open QuickBooks. Click the Payments and Customers tabs to see charts and tables focused on those elements of your accounting data.
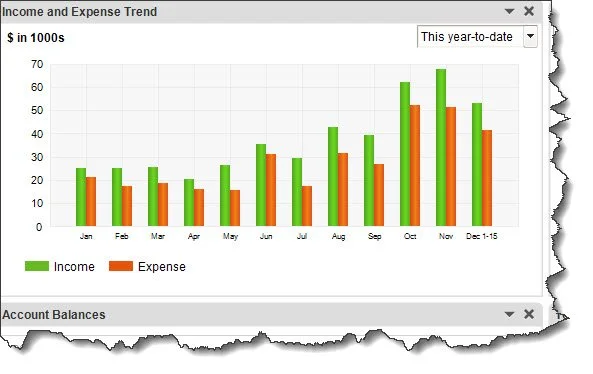
The Income and Expense Trend chart from the Company Snapshot.
Transaction History
This tool can be helpful in tracking all the parts that go into a transaction. Create a report, then highlight the transaction you’re interested in by clicking it once (don’t click it twice – this will open the actual transaction). Open the Reports menu and click Transaction History to open a mini report.
Reports That Require Analysis
There are a handful of reports that you can run in QuickBooks, but which would be hard for you to analyze. These are called standard financial reports, the kind you need when you’re applying for a loan or seeking financing. They include Balance Sheet and Profit & Loss. They can provide insight into your company’s financials even if you’re not trying to get financing. We’d be happy to create and interpret these for you on a quarterly basis, or whenever you’d like us to. As always, we’re available for any of your QuickBooks questions.

Total Business Care Can Help
For more information, please contact the Accounting Team or email the office at info@totalbizcare.com to make an appointment.
To view more about the TBC Accounting Team, please visit our Accounting page or our QuickCare℠ page.